
GBP/USD has printed a fresh day’s high at 1.2330 as the USD index has continued its downside journey.
The cable is auctioning in a Rising Channel chart pattern in which every pullback is considered as a buying opportunity.
A range shift move by the RSI (14) into the bullish territory of 40.00-80.00 cement more upside ahead.
The GBP/USD pair printed a fresh day high at 1.2330 in the early European session. The upside bias for Cable is backed by further weakness in the US Dollar Index (DXY) as the Federal Reserve (Fed) is approaching the phase of policy-tightening. Also, rising hawkish bets for Bank of England (BoE) policy after a surprise jump in the United Kingdom inflation is supporting the Pound Sterling.
GBP/USD four-hour chart
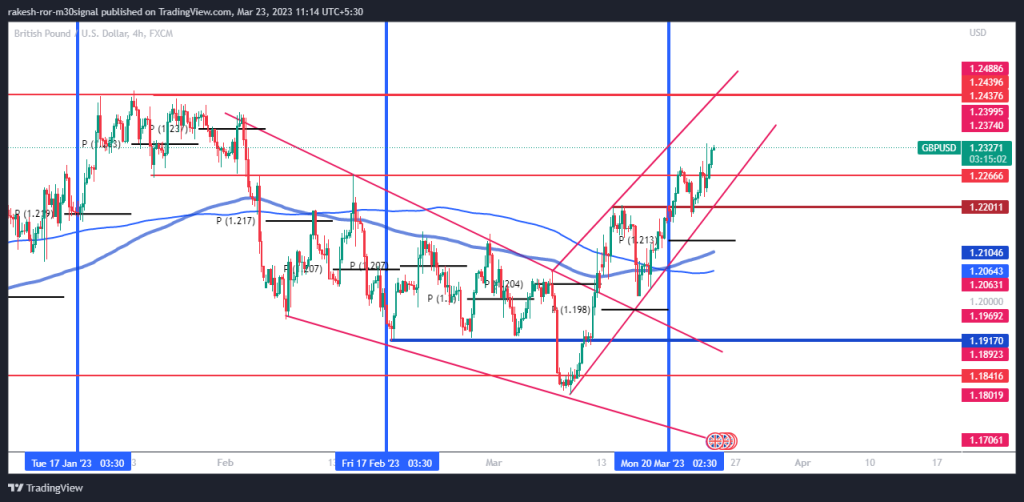
GBP/USD is auctioning in a Rising Channel chart pattern on a four-hour scale in which every pullback is considered as a buying opportunity by the market participants. The Cable is marching towards the horizontal resistance plotted from December 13 high at 1.2444.
The 20-period Exponential Moving Average (EMA) at 1.2245 is providing cushion to the Pound Sterling bulls.
A range shift move by the Relative Strength into the bullish arena of 40.00-80.00 from the bearish region of 20.00-60.00 indicates more upside ahead.


